Idea:
What better way to get ready for a year full POW, KAABOOM and SHAZZZAM than with a Superhero data viz! This idea came from a data set I found on kaggle.com. After searching all over the globe (ok, mainly the internet) this data set just jumped out at me- like a superhero kick to the geeky side of the head. I should do a data visual on comic book characters and their stats! (It's the small things that make a comic-book data nerd excited, I tell ya.) The idea is to compare the stats of various superheroes, pairing up one character with another in a battle of the stats. Who wants to place a bet...will it be YOUR favorite superhero who rules the data today?Data Viz:
Here is a link to the Tableau Public page.
Insight:
First, let's consider some of the things that make a hero, well, SUPER. We can use data to evaluate each superhero by strength, speed, durability, intelligence, combat skill and overall power.
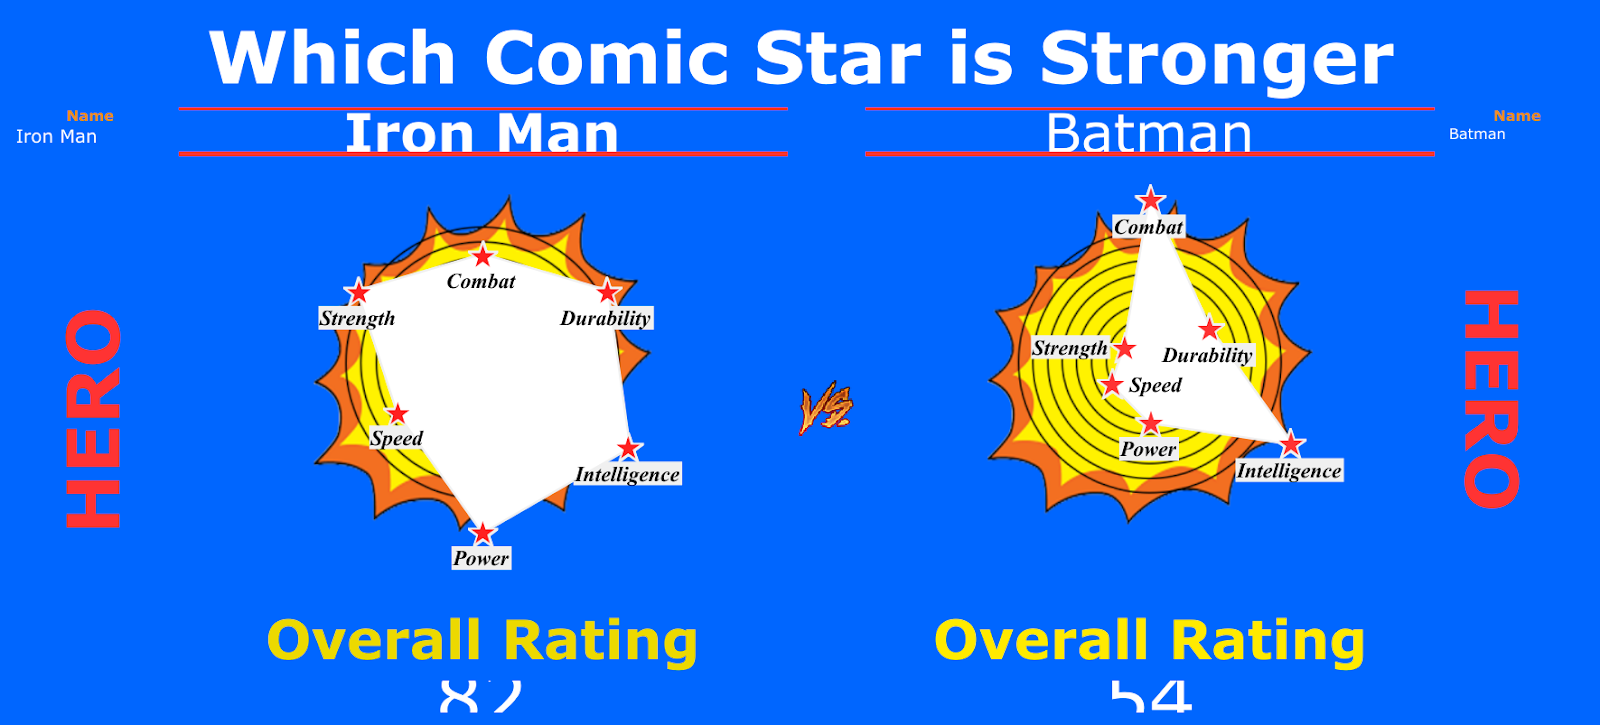
To get started, let's take a look at Batman vs. Ironman- which hero is stronger based on these compiled hero skills?
Any comic fan knows these two popular heroes (each from different superhero worlds, no less), but what if they had to go up against each other?! Let's find out! It's the battle of rich men with cool gadgets! Both of these superheroes have money, and both have super cool toys to fight crime with. But who would win in a duel?
When comparing Batman vs. Ironman, it becomes pretty clear that while their bank accounts may be similarly stacked, Iron Man has a far wider variety of skills. Let's hope Alfred stocked up on the first aid kit. Don't believe me? Well, let's take a look at the chart:
Our next match up is all about the ladies... Sorry, boys, but these girls got some POWER! Sticking with the trend of picking heroes from two different comic universes, let's see what Wonder Woman and She Hulk bring to the table. Let the stiletto-wearing warrior battle begin!

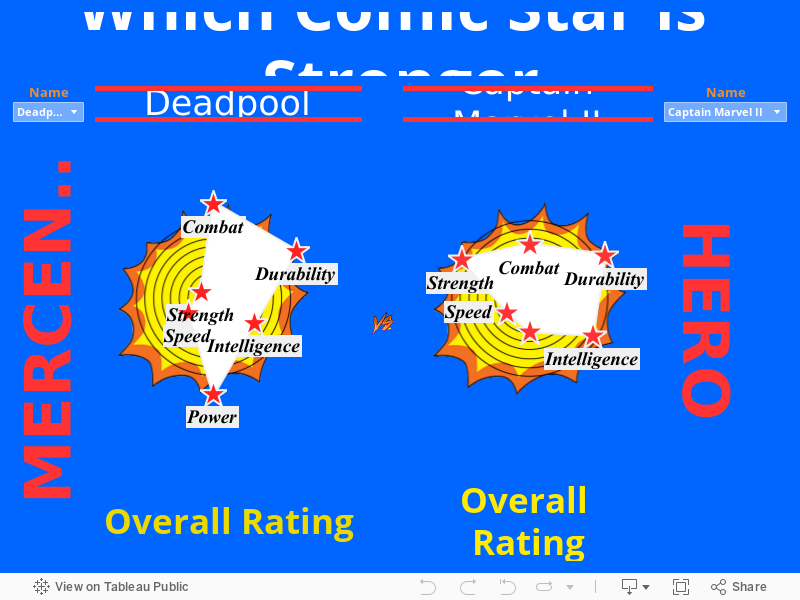
In honor of the hilarious friend-feud between Ryan Reynolds and Hugh Jackman, let's match up Deadpool and Wolverine. This battle ends in a close tie, so it's a good thing they get along (sort of). The only real edge Deadpool has is with a higher power stat. But considering both heroes can regenerate, this battle would definitely be a 10-rounder.

Don't be shy...use the table to match up YOUR favorite heroes and villains to see who would win in a match. Who knows, you might be KAPOWED! by the results.
Project:
The project was to use the existing data set found on kaggle.com to make something fun and different. The idea of using comic book characters and comparing their individual stats brings back the good old days of trading cards on the playground. The best thing about those old school trading cards was the stats. This project, then, is like virtual baseball cards for nerds. (Or would it be like Pokemon cards for cool people?)Tools:
- Table Public
- Adobe Photoshop
Data:
The data set came from Kaggle user Daniel R (Thank you, you're awesome). Daniel R has a large selection of data perfect for this type of analysis. The data set chosen specifically for this project was the character stats CSV file:- Character Stats (CSV) (Kaggle) (Google Sheets)
Data Cleaning:
This set came with everything needed to start an analysis. The only clean up required was with correcting the empty, or "null", fields. This can be easily completed in Tableau.Process:
The process begins with the download of the CSV file, to then import into Tableau. (The version of Tableau used was Tableau Public 2018.3.) Tableau does not play well with the structure of this dataset. The dataset needed to be pivoted to help Tableau read it easily, which was done by selecting the skill type of columns and right-clicking. By then selecting the Pivot option, the data moves into a more manageable structure. This will make the process of generating the radar chart easier.The first order of business was to create a spider chart to display the stats of each character. To create the X-axis part of the circle design is to make some "Calculated Field..." entries. The X stats formula used:
CASE [Stats Name]
WHEN 'Combat' then 0
WHEN 'Durability' then [Stats Value] *SIN(2*PI()/6)
WHEN 'Intelligence' then [Stats Value] *SIN(2*2*PI()/6)
WHEN 'Power' then [Stats Value] *SIN(3*2*PI()/6)
WHEN 'Speed' then [Stats Value] *SIN(4*2*PI()/6)
WHEN 'Strength' then [Stats Value] *SIN(5*2*PI()/6)
END
The X stats axis is followed up with the Y stats:
CASE [Stats Name]
WHEN 'Combat' then [Stats Value]*COS(0)
WHEN 'Durability' then [Stats Value] *COS(2*PI()/6)
WHEN 'Intelligence' then [Stats Value]*COS(2*2*PI()/6)
WHEN 'Power' then [Stats Value] *COS(3*2*PI()/6)
WHEN 'Speed' then [Stats Value] *COS(4*2*PI()/6)
WHEN 'Strength' then [Stats Value]*COS(5*2*PI()/6)
END
The next part was to add the pills to the worksheet. This creates the layout of small little circles. To make the area chart, just change to "polygon" and select the line type for Stat Names. This creates the weird looking shape that looks like a comic style "KAPOW!" word art. To give the labels of the various points, the X-axis was added to the worksheet again with a dual axis and shows the simple, small shape and the labels of each skill.
A background was inserted (after being created in photoshop) with the rings in sizes of 10 for the chart. For added flair, the comic word art frame was added to the back of the circle. Sticking with this theme, a second sheet was created to provide the same style of the chart for the "vs" character.

The word art frame

The final background for the chart
Lastly, labels were added to the dashboard explaining the allegiance of the character, name, and overall rating. The overall rating was comprised of the average of all six (6) skill scores. The data set came with a cumulative total, but calculating the average provides a better-rounded picture of the status for purposes of this data viz.
The final trick was to assign the filters to prevent a master filter from changing all the charts. This is completed by using the assigned 'filter to worksheet option' in the filter menu. After the correct assignment of charts, the matchup can begin!
Comments
Post a Comment