Idea:
You've seen it. You know the scene all too well...that horrifying moment you're in the bathroom, washing your hands, and two or three people come out of the stalls...
...and head straight for the door...
(insert scream here)
Have you ever wondered, 'Just how many people ACTUALLY wash their hands after they pee?!' Prepare yourself, you will NOT be the same after this data viz. Take a deep breath, set some hand sanitizer on your desk, and get ready to have your mind blown.
The idea for this data set makeover was to be able to highlight some important information that can be used to change the results in the future- i.e. build awareness about a problem or issue. The thing I wanted to find out most is a) WHERE are people least likely to wash their hands, and b) HOW MANY people actually wash their hands (or not) after using the bathroom. I am also going to use this data to highlight which gender is cleaner: males or females. I am going to showcase all of this information in a basic dashboard (like those used in business meetings). No infographic is necessary for this project.
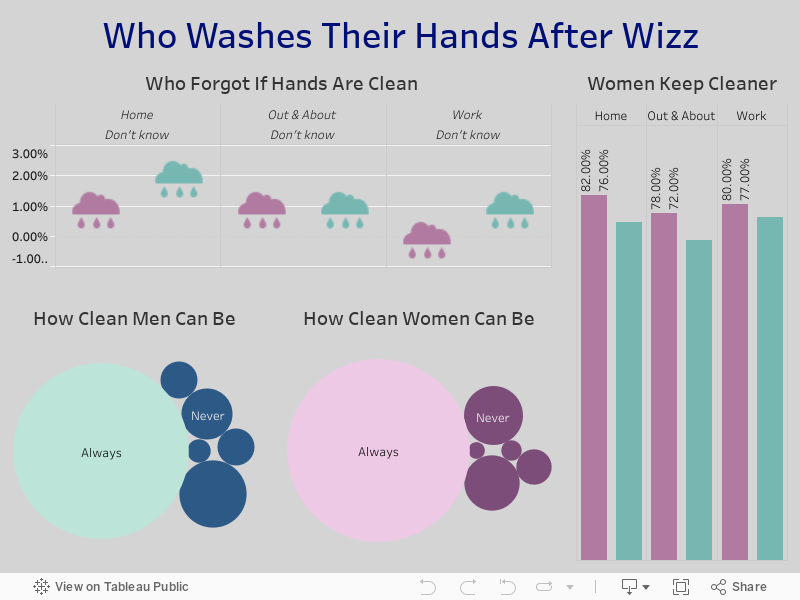
Data Viz:
Insight:
After looking at the data, we discover two shocking facts. First, almost 2 out of 5 people DO NOT wash their hands after peeing. That number is a lot higher than one would expect, considering the circumstances. I mean, there is actual PEE involved here, people.

Second, it was really surprising to see how many people did NOT even KNOW if they wash their hands after using the toilet. I'm calling a definite B.S. card here... who actually does not know if they washed their hands after going potty? I think we could probably say that the bulk of these people would actually fit into a 'Too Embarrassed To Admit I DONT Wash My Hands' category.

So after looking at this data, I have a pretty valuable piece of advice for you. Watch out when shaking a guy's hand in a meeting! Maybe stash some hand wipes in your desk drawer for after they leave. In any meeting of 4 or more men, you will shake the hand of someone who did not wash their hands after peeing. GROSS!
Going back to the original goal of using existing data set to build awareness, the main goal would be to increase the number of people that wash their hands after using the bathroom. This 'correction implementation' could be a simple propaganda technique, such as adding a poster or sign on the bathroom door to remind people to wash their hands after going pee. You could really make it interesting with a poster that says "Don't touch MY hand and spread YOUR pee germs! WASH YOUR HANDS!"
Last bit of advice from this data viz, wash your hands before you eat! Or you might be eating your food with a little bit of someone's wizz.
Second, it was really surprising to see how many people did NOT even KNOW if they wash their hands after using the toilet. I'm calling a definite B.S. card here... who actually does not know if they washed their hands after going potty? I think we could probably say that the bulk of these people would actually fit into a 'Too Embarrassed To Admit I DONT Wash My Hands' category.

So after looking at this data, I have a pretty valuable piece of advice for you. Watch out when shaking a guy's hand in a meeting! Maybe stash some hand wipes in your desk drawer for after they leave. In any meeting of 4 or more men, you will shake the hand of someone who did not wash their hands after peeing. GROSS!
Going back to the original goal of using existing data set to build awareness, the main goal would be to increase the number of people that wash their hands after using the bathroom. This 'correction implementation' could be a simple propaganda technique, such as adding a poster or sign on the bathroom door to remind people to wash their hands after going pee. You could really make it interesting with a poster that says "Don't touch MY hand and spread YOUR pee germs! WASH YOUR HANDS!"
Project:
This was a data set for Makeover Monday on Data.world. The project was to makeover a data viz from YouGov.com. The task was to improve the data viz. This data set is about people who wash their hands after going to the bathroom and who will admit they do not.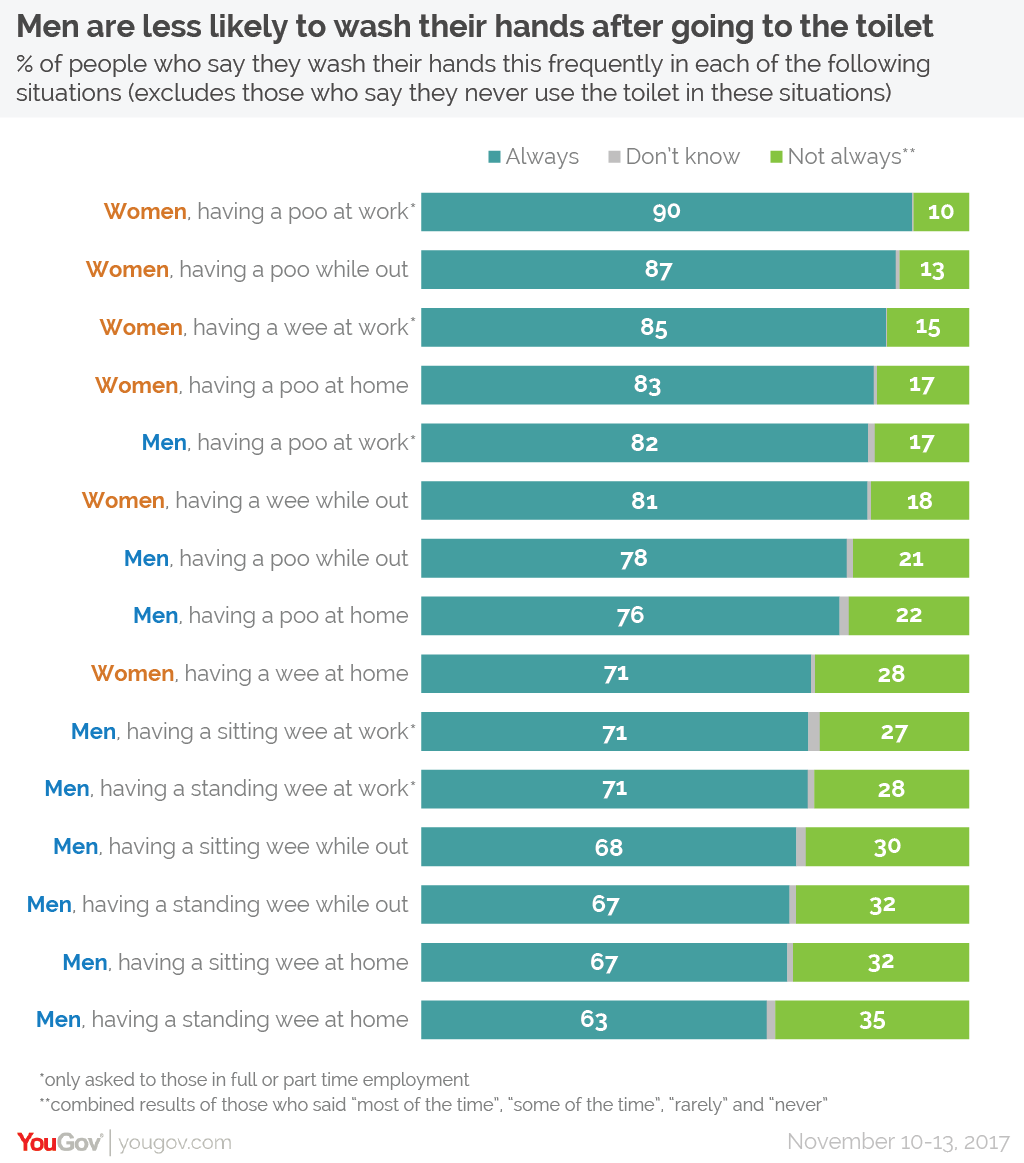
Tools:
- Tableau Public
Data:
This dataset comes with just a summarized view of the data. It has a response count from a survey of men and women. The responses are classified in six (6) different answers. The questions asked come in three different categories, home, work, and out & about. The respondent answers how often they wash their hands after going to the bathroom in the questioned location. The numeric values are in percentage of responses. Here is the dataset in CSV from the data.world site.Data Cleaning:
This dataset was already cleaned and ready for import into Tableau Public. Once imported into Tableau, I changed the characteristics of the numbers from decimals into a percentage.Process:
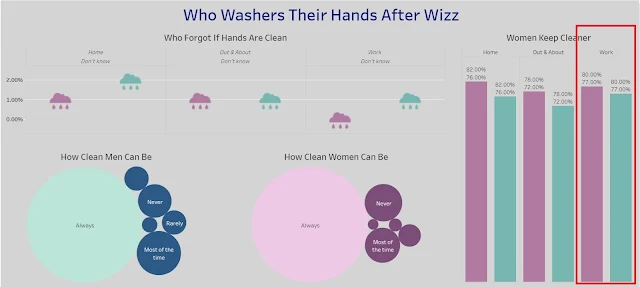
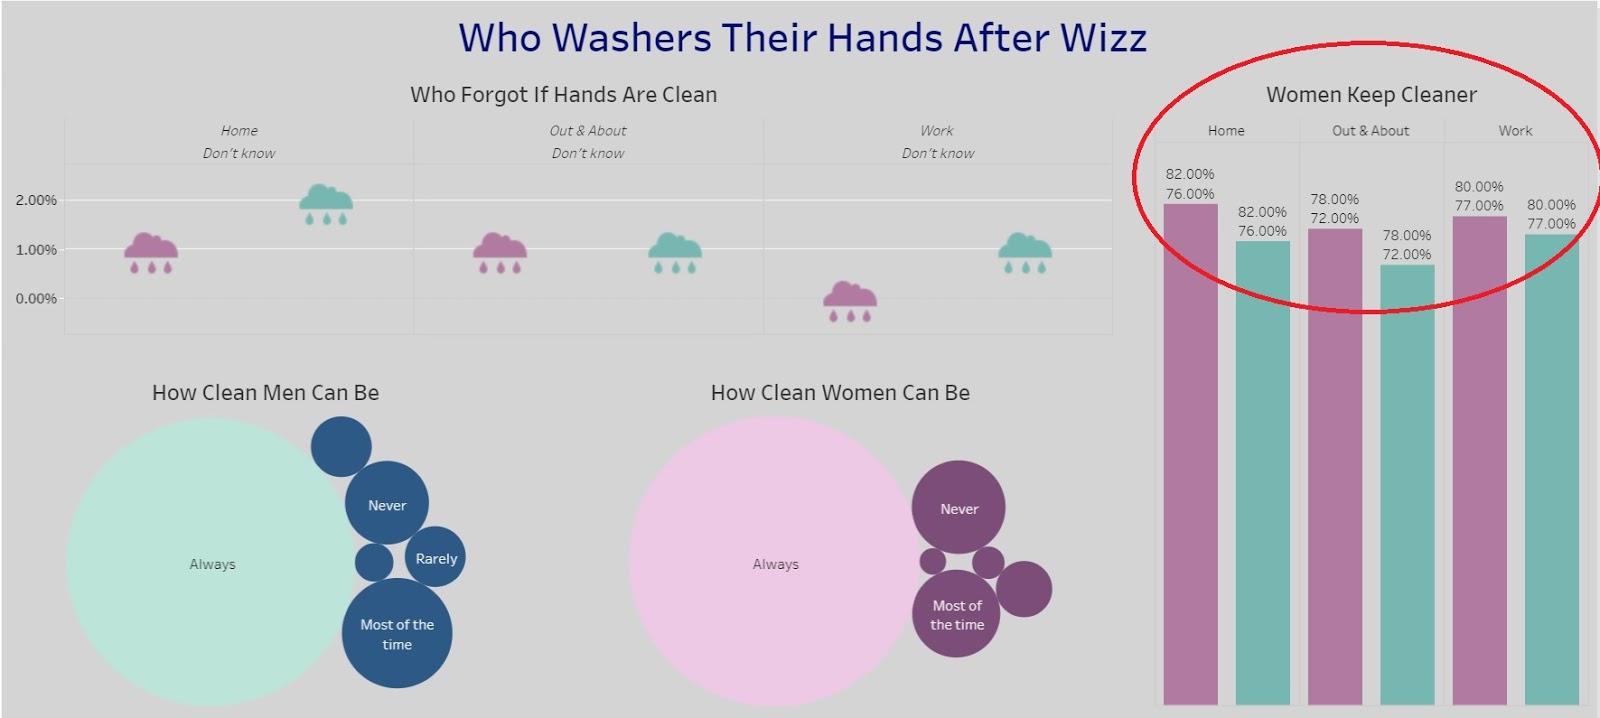
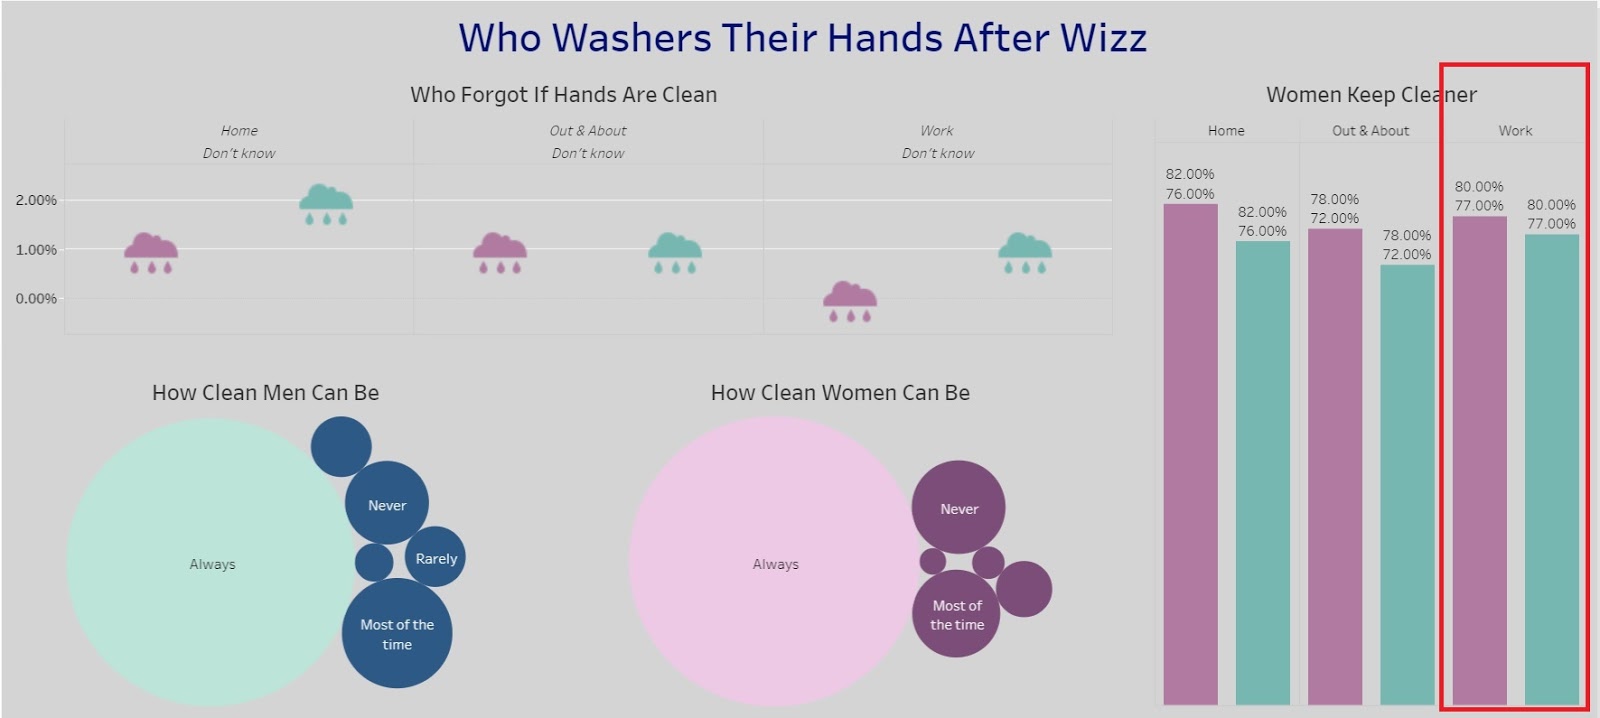
The general process was to compare men to women and see which gender is statistically cleaner. Showing how clean men and women were was displayed with a bubble chart. The size of the bubble was adjusted to correspond with the response rate of the answer. The next chart was created to highlight which gender was cleaner. This was created with a double bar chart highlighting the difference between women being cleaner over men in all the questions.In the middle of the analysis, I discovered something really unique. The information I found surprising was the number of people who did not know whether or not they wash their hands. How does person actually not remember if they washed their hands? I decided to display this as a comparable scatter chart with a rain cloud. This chart also highlights the difference between gender.
Comments
Post a Comment